A proposal for saving five million hours per year (one day per teacher) of workload, without harming pupil achievement

Estimated reading time: 8 minutes

Part 1: Data drops and measurement error

Many schools regularly collect, and then centrally deposit, test data to with the aim of tracking pupil progress and planning ‘interventions’ for students who are falling behind. Indeed, Teacher Tapp data from 2023 shows that 36% of (7,674) respondents work in schools that do this half termly or more and 88% of respondents work in schools that do this termly or more.

Last year, FFT Datalab wrote a blog using data on hundreds of thousands of termly tests to look at the variation in standardised scores from one term to the next. How much would we expect a primary pupils’ maths score to change from Autumn to Spring term, for example?

Most pupils move very little. On a scale where two thirds of pupils score between 85 and 115, half of pupils’ Spring term scores are within 5 points of their Autumn term score. But some pupils show more change. Just under a third of pupils’ Spring term scores are 5-10 points away from their autumn term score.

This data allows us to ask a second interesting question: how many pupils change their score enough that a test can reliably detect that change?

Measurements can only ever be so accurate. If I asked three people to measure my height in millimetres, for example, I would get three slightly different answers. The difference reflects measurement error. This is somewhat random in nature – some measurements would be too high and others too low.

Pupil test scores also contain measurement error. And thanks to a recent Education Endowment Foundation review, we now know more about the size of measurement error in some commercially available tests. This allows us to say some useful things about the smallest change in pupil test scores that we can detect with a given level of confidence.

Keep in mind the analogy with measuring height here. If my 16-year-old cousin measured 165cm in 2023 and 175cm in 2024, we could be pretty confident that they had genuinely grown. But if they measured 165cm in 2024 and 165.1cm in 2025, we couldn’t confidently rule out that the change was just pure measurement error.

Based on the information in the EEF review, it turns out that carefully designed tests can, with 90% confidence, detect a change in standardised test scores of about 13 or more.[i] So how often do pupils make a change of 13 or more?

The chart below shows changes from Autumn to Spring (top panel), Spring to Summer (middle panel) and across two terms from Autumn to Summer (bottom panel). The pink lines show changes greater than 13 points (up or down). Interventions are usually focused on those whose scores have fallen, which makes the left-hand pink line the relevant one.

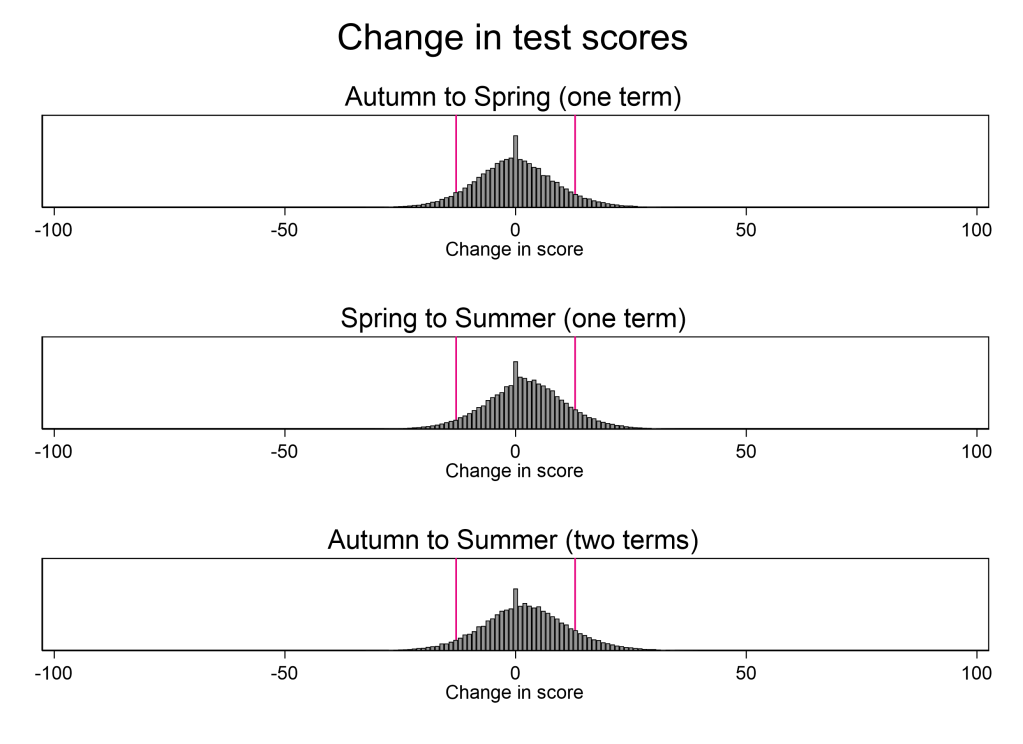
What’s notable from the graphs are how few pupils we can conclude (with 90% confidence) have changed their score at all. When we look at the change across one term (the top two graphs), only about one in twenty (5-7%) see a fall in test scores that can be detected with a well-designed test. When we look at change across two terms (bottom graph), this remains essentially unchanged at 6%.

For pupils who make smaller changes from one term to the next, we can be correspondingly less confident that they have changed at all. Half of pupils change by five points or less from one term to the next. We can be less than 50% confident (worse than a coin flip!) that this is not just pure measurement error. A third of pupils change by 5-10 points from one term to the next. We can be 50-80% confident (a little better than a coin flip) that this is not just pure measurement error.

For a number of reasons, the situation is likely to be worse than this in most schools. First, the above analysis is based on the precision of a carefully designed tests developed by assessment experts, but most schools use less precise tests that have been developed in-house. Second, the above analysis is based on the precision of a science tests, but most subjects are harder to assess than science. Third, the above analysis is based on the precision of tests for the average scoring students, but most students do not get the average score and tests become less precise for pupils that are further from the mean. I suspect the proportion of pupils for whom we can conclude (with 90% confidence) that their score has declined from one term to the next is closer to 0% than it is to 5-7%.

This does not mean these tests are uninformative. Averaging across the pupils in a group helps cancel out the measurement error. The test scores might be useful for school leaders looking to understand progress in a given subject or cohort. But when it comes to capturing pupil-level change from one term to the next, termly testing is only informative for a very small minority of pupils.

Part 2: Data drops and teacher workload

The above matters because data drops generate additional work for teachers and England has a problem with workload. In the TALIS 2018 data, teachers in England have some of the highest working hours among all participating countries.

Back in 2018, the government’s Making Data Work report stated that:

“We have not encountered any examples of schools where the actions arising after a half termly deposit of attainment data justify the time investment required by teachers to facilitate six data collection points a year.

Unless attainment information can be collected with no marking or data inputting time outside teachers’ lesson times, we see no reason why a school should have more than two or three attainment data collection points a year, which should be used to inform clear actions.”

In the subsequent five years, the proportion of Teacher Tapp respondents working in schools doing half-termly data drops fell from 56% to 36%. I suspect that leaders in the remaining third believe that the particular/special way in which they do it in their school does justify the time required.

However, based on the new information we have gained since 2018 (see part 1 above), it is pretty clear that half termly data drops are not justified because for 95% or more of pupils, we can’t confidently distinguish a fall in their test score from pure measurement error. We have been allocating pupils to ‘interventions’ based very largely on random noise.

If this still feels counterintuitive, remember the analogy with height. Trying to measure change in height over 48 hours isn’t a sensible thing to do because the expected change is dwarfed by the measurement error.

This is good news. It means we can cut teachers’ workload without any material risk of harming students’ education.

We can still regularly test pupils, which is great for learning. But the time-consuming marking, data entry, meeting cycles and targeted intervention planning can all be done away with.

How much workload could we save? We can do some back-of-the-envelope calculation to get a sense of this.

I conducted a not-very-scientific Twitter/X poll to understand how many hours of workload are involved per data drop per teacher. The median response seems to be about 3 hours. When I have shown these results to teachers they have suggested this looks on the low side. But let’s adopt this as a possibly conservative assumption.

Let’s start by considering a scenario in which all schools move to doing no more than termly (three per year) data drops. For the sake of argument, let’s assume the 36% of Teacher Tapp respondents who report doing half-termly data drops are spread equally across these schools and the schools are of approximately equal sizes.

There are 567,309 teachers in England, meaning that approximately 204,231 (36%) are doing half-termly data drops. Reducing this to termly would save 3 (data drops) multiplied by 3 (hours per data drop), or 1.83 million hours of workload systemwide. This amounts to just over one working day (9 hours) per year for each teacher in these schools. The case for making this change is very strong.

Having said that, I am pretty doubtful that termly data drops are justified. They are not helpful for targeting interventions at struggling pupils because the data on which they are based consist very largely of measurement error / random noise. Based on conversations that I have had with experienced headteachers, I am also doubtful that termly data drops are helpful for school leaders. What kind of subject-wide or cohort-wide changes would leaders actually implement on a term-to-term basis in response to this data? You wouldn’t change the curriculum every term or change the leadership of maths department every term. At the end of an academic year, maybe; but not termly.

On the basis that there is no point collecting data you would not act on, let’s consider a scenario in which all schools move to doing one data drop per year. That means that 204,231 teachers would drop from 6 per year to 1 per year, collectively saving 3.06m hours per year. Again, based on Teacher Tapp data, a further 295,000 (52%) of teachers do between 3 and 5 data drops per year. Let’s assume they are all doing 3 per year and would drop to one. This would collectively save 1.77m hours per year. Finally, Teacher Tapp suggests that another 39,711 (7%) are doing 2 data drops per year and these would now drop down to one. Collectively, they would save another 0.12m hours per year. Across all three groups, this amounts to a saving of 4.95m hours of workload per year, which is just over one day per year (8.7 hours) for every teacher in the country.

Many schools in England have recently made the courageous move to do away with written marking on the grounds that it is time consuming and has negligible benefit. It’s time to think equally radically about data drops.

Thanks to Teacher Tapp and FFT Education for providing the data for this blog. Thanks also to the other members of the government’s Teacher Workload Taskforce for helping me to test and refine these arguments.

I have checked the above analysis with experts in education and psychometrics. If you can find an error, please leave a comment below and I will 1) amend the blog 2) state exactly how it has been amended here.


[i] This is based on the Standard Error of Measurement (SEM), which is 5.6 (at the mean) for the Progress in Science 10 test in England. The Smallest Detectable Change (SDC) is the SEM x 1.414 x the relevant critical value for the confidence level. The formula for this is given in Geerinck et al and the references therein. The SEM is larger away from the mean, which implies that for most pupils the SDC is actually larger than 13.

Evidence, expertise, and the self-improving school system

(9 minute read)

Rob Coe used his 2013 inaugural lecture at Durham to survey the evidence on long-run change in the performance of the English school system. He concluded that standards had not improved over the last 30 years.

Recently, Dylan Wiliam tweeted that maybe, just maybe, we are now starting to see sustained improvements in the quality of teaching and learning.[i] At times, I have been tempted by the same thought. Only time (and more data) will tell.

How can we account for the lack of improvement described by Coe? And what would it take to transition from the flatlining system that Coe observed to the self-improving system that everyone hopes for? This blog sets out one useful way of thinking about this.

The Gifts of Athena

Joel Mokyr tackles an analogous problem in his book The Gifts of Athena. How did we move from millennia of zero economic growth prior to the 1800s, to the sustained economic growth experienced since? Mokyr’s final answer doesn’t translate neatly to education. But the conceptual framework he develops is helpful in thinking about the transition to a self-improving school system.

This framework is built on a distinction between two types of knowledge. First, knowledge that, which refers to beliefs about how the world works. For example, hot air rises. These beliefs are either correct or incorrect. An addition to knowledge that would be described as a discovery.

Second, knowledge how, which refers to techniques for getting things done. For example, how to operate a hot air balloon. Rather than correct or incorrect, these techniques are either successful or unsuccessful. An addition to knowledge how would be termed an invention or an innovation.

This distinction will be familiar to many. But Mokyr adds several original insights, illustrated with examples from the history of science:

  1. Knowledge that constrains knowledge how. It is inconceivable, for example, that somebody would know how to build the first steam engine without first knowing that the condensation of steam creates a vacuum. This is not the only thing you would need to know, but you would need to know it.
  2. A single piece of knowledge that can support many different pieces of knowledge how. Before the steam engine was invented, the knowledge that condensation causes a vacuum was used to invent the steam pump.
  3. The knowledge that underpinning some knowledge how may be more or less broad/general. For example ‘water condenses at 100 degrees centigrade’ is less broad/general than ‘water condenses at 100 centigrade at sea level and condenses at lower temperatures at higher altitudes’. More broad/general knowledge that makes for more reliable knowledge how e.g. the design of steam engines for operation at different altitudes.
  4. The least broad/general amount of knowledge that which can underpin some knowledge how is simply the statement that ‘x works’. For example, Henry Bessemer discovered his method for making steel (knowledge how) by accident. Only later did chemists come to discover the underlying chemistry: he happened to be using pig iron devoid of phosphorus. All that Bessemer knew was that it worked.
  5. Both knowledge that and knowledge how vary in how accepted they are. At the individual level, this amounts to somebody’s confidence in some claim. At the social level, this amounts to how widely accepted something is. Claims that are hard to verify are less likely to be accepted or will take longer to be accepted. The effect of tobacco smoke on cancer is a tragic example of such a hard-to-verify claim.
  6. When knowledge how is better supported by knowledge that, people are more likely to accept the knowledge how. For example, several surgeons had found that sterilizing medical instruments reduced post-operative infections, but the practice only became widely adopted after scientists later discovered the role of bacteria in the transmission of infection.
  7. The difficulty of getting hold of either knowledge that or knowledge how can be thought of in terms of access costs. Sometimes access costs are financial, such as university tuition fees. Sometimes they are better measured in time, such as the difficulty of sifting through competing arguments and sources of information to reach a conclusion. Either way, access costs impede the spread of knowledge.

Expertise and the flatlining school system

Let’s look at Coe’s flatlining education system (1980-2010) through Mokyr’s eyes.

Experienced teachers in this system have plenty of knowledge how, derived from years of error-prone learning on the job. However, the sum total of knowledge that is not much larger than the sum total of knowledge how. Like Bessemer and his method of producing steel, expert teachers often just know that certain things work.

However, even these experienced teachers find their hard-won knowledge how to be somewhat unreliable. Like the condensing of water, what works seems to vary in subtle ways across contexts. The knowledge that underpinning teachers’ knowledge how is narrow, making it easy to misapply the knowledge how.

The knowledge how gleaned by expert teachers is also hard for others to verify. Knowledge how can and does pass between colleagues in the form of advice. But acceptance of this advice largely depends on trust. The movement of knowledge around the system is therefore limited to social networks, usually within particular schools. In the absence of supporting knowledge that, the costs of verifying expertise among strangers are usually too high.

This process of trust-based learning from colleagues is also error prone, with teachers borrowing both successful and unsuccessful knowledge how. As with smoking, the classroom environment makes it hard to ascertain the consequences of certain actions. Nevertheless, the sharing of successful knowledge how leads to pockets of excellence emerging in particular schools at particular times.

Crucially, every time a teacher retires, they take with them the accumulated knowledge how that they have gleaned from a careers-worth of careful trial-and-error and advice taking. They could try to write it down, but how would anyone beyond their personal network verify whether it was successful knowledge how? Somewhere, a newly qualified teacher takes the place of the retiring teacher and begins the process of learning on the job from square one.

In sum, the difficulty of sharing knowledge means that the system gains knowledge how at the same rate it forgets it. Mokyr’s framework can explain the flatlining school system.

Evidence, expertise, and the self-improving school system

How might the transition to a self-improving school system happen?

Recent improvements in the quality of research mean that knowledge that about teaching and learning is starting to accumulate. Progress is slow but steady in multiple areas: the science of reading, cognitive psychology, large-scale trials of different curricula and pedagogical approaches, quasi-experimental evaluations of e.g., national literacy interventions. Crucially, once gained, this knowledge that is unlikely to be lost. It does not leave the system each time a teacher retires. This allows for cumulative growth in such knowledge.

Like condensing steam creating a vacuum, a single piece of knowledge that can support the development of multiple pieces of knowledge how. For example, knowing that working memory is limited supports the knowledge how integrating labels within a diagram supports learning, and the knowledge how providing worked examples supports learning. This multiplier implies that the frontier of evidence-based practice can at times advance faster than the evidence on which it depends.

Teachers can also use this knowledge that to verify knowledge how. For example, expert teachers have long recognised the value of asking many questions of their pupils. The knowledge that retrieval practice helps solidify learning in long-term memory helps secure wider acceptance and uptake of this good practice. This helps spread successful knowledge how beyond the confines of personal networks, across the wider system. Knowledge that makes knowledge how more sharable.

Increasing the breadth/generality of knowledge that should also accelerate this process by increasing the reliability of knowledge how. For example, our increasingly broad/general knowledge that about how exactly retrieval practice works allows us to use retrieval practice better. More precisely, our knowledge that retrieval practice consolidates memories through reactivation implies the knowledge how that teachers should provide sufficient time for all pupils to reactivate memories between posing a question and taking an answer. Increasing the reliability of knowledge how further enhances its acceptance.

The school system described here accumulates and spreads both knowledge that and knowledge how. Mokyr’s framework can also explain the self-improving school system.

So what? Speeding up the transition…

Mokyr’s framework might also help us speed up the transition to a self-improving school system. Here are three suggestions:

  1. Recent funding for ESRC education research, the Education Endowment Foundation, and the establishment of the new National Institute of Teaching will help further expand our knowledge that. As well as looking for new knowledge that, these funders should commission research aimed at broadening/generalising existing knowledge that. This might require lab experiments designed to directly test theory. This will help make knowledge how more reliable and, in doing so, help it to spread.
  2. Research synthesis should focus on distilling mental models of teaching/learning on the grounds that these have rich implications for knowledge how. This contrasts with simply aggregating effect sizes in meta-analyses, which provides only very narrow know that – ‘it works on average’. Given the importance of context in education, this is unlikely to be useful for an individual teacher. Mental models provide broader and interconnected knowledge that, which supports teachers’ to reason about how to adapt knowledge how for their setting. For some brilliant examples of this outside of education, see this blog.
  3. While we have made considerable advances in sharing knowledge that around the system (research reviews, books, teacher conferences), we are nowhere near as good at sharing knowledge how in a trustworthy way. Copying of practice frequently occurs, but it is highly error prone. A more trustworthy approach might involve identifying the best teachers using value-added data, systematically observing their practice to see how they use evidence-based teaching practices, and then capturing annotated videos of this triangulated knowledge how. This would provide a less error-prone way of sharing the considerable knowledge how that is already present in the school system.

In sum, Mokyr’s framework helps bring into focus three ways in which evidence interacts with expertise to contribute to a self-improving school system: knowledge that helps develop new knowledge how, spread knowledge how around the profession, and make this knowledge how more reliable. Pessimists sometimes fret that evidence constrains teachers’ autonomy, thereby compromising their professionalism. On the contrary, Mokyr’s framework illustrates how knowledge that gives teachers the basis on which to discuss and share their knowledge how. Indeed, the right kind of knowledge that actually creates opportunities for teachers to generate new knowledge how and reason flexibly about how it might need to be adapted for their context. Evidence therefore connects and empowers teachers, rather than constraining them.


[i] I looked back for this tweet but struggled to find it. If this is a misrepresentation, I am happy to change it.

Four reasons instructional coaching is currently the best-evidenced form of CPD

At the ResearchEd 2018 National Conference, Steve Farndon, Emily Henderson and I gave a talk about instructional coaching. In my part of the presentation, I argued that instructional coaching is currently the best-evidenced form of professional development we have. Steve and Emily spoke about their experience of coaching teachers and embedding coaching in schools. This blog is an expanded version of my part of the presentation…

What is instructional coaching?

Instructional coaching involves an expert teacher working with a novice in an individualised, classroom-based, observation-feedback-practice cycle. Crucially, instructional coaching involves revisiting the same specific skills several times, with focused, bite-sized bits of feedback specifying not just what but how the novice needs to improve during each cycle.

In many ways, instructional coaching is the opposite of regular inset CPD, which tends to involve a broad, one-size-fits-all training session delivered to a diverse group of teachers, involving little practise and no follow-up.

Instructional coaching is also very different to what we might call business coaching, in which the coach asks a series of open questions to draw out the answers that people already, in some sense, know deep down. Instructional coaches are more directive, very intentionally laying a trail of breadcrumbs to move the novice from where they are currently, to where the expert wants them to be.

Some instructional coaching models include a rubric outlining the set of specific skills that a participant will be coached on. Others are even more prescriptive, specifying a range of specific techniques for the teacher to master. There are also a range of protocols or frameworks available to structure the coaching interaction, with Bambrick-Santoyo’s Six Step Model being among the most popular.

Examples of established instructional coaching programmes for teachers include the SIPIC programme, the TRI model, Content Focused Coaching and My Teaching Partner. In the UK, Ark Teacher Training, Ambition Institute and Steplab are three prominent providers of instructional coaching.

What is the evidence for instructional coaching?

In 2007, a careful review of the literature found only nine rigorously evaluated CPD interventions in existence. This is a remarkable finding, which shows how little we knew about effective CPD just a decade ago.

Fortunately, there has been an explosion of good research on CPD since then and my reading of the literature is that instructional coaching is now the best-evidenced form of CPD we have. In the rest of the blog, I will set out four ways in which I think the evidence base for instructional coaching is superior.

Before I do, here are some brief caveats and clarifications:

  • By “best evidenced”, I mean the quality and quantity of underpinning research
  • I am talking about the form of CPD not the content (more on this later)
  • This is a relative claim, about it being better evidenced than alternative forms (such as mentoring, peer learning communities, business-type coaching, lesson study, analysis-of-practice, etc). Remember, ten years ago, we knew very little about effective CPD at all!
  • I am talking about the current evidence-base, which (we hope) will continue to develop and change in coming years.

Strength 1: Evidence from replicated randomised controlled trials

In 2011, a team of researchers published the results from a randomised controlled trial of the My Teaching Partner (MTP) intervention, showing that it improved results on Virginia state secondary school tests by an effect size of 0.22. Interestingly, pupils whose test scores improved the most were taught by the teachers who made the most progress in their coaching sessions.

Randomised controlled trials (RCT) are uniquely good at isolating the impact of interventions, because the process of randomisation makes the treatment group (those participating in MTP) and control group (those not) identical in expectation. If the two groups are identical, then any difference in outcomes must be the result of the one remaining difference – participating in the MTP programme. Unfortunately, the randomisation process does not guarantee the two groups are identical. There is a small chance that, even if MTP has zero effect on attainment, a well-run RCT will occasionally conclude that it has a positive impact (so-called random confounding).

This is where replication comes in. In 2015 the same team of researchers published the results from a second, larger RCT of the MTP programme, which found similar positive effects on attainment. The chances of two good trials mistakenly concluding that an intervention improved attainment, when in fact it had no effect, are far smaller than for a single trial. The replication therefore adds additional weight to the evidence base.

There are however, other CPD interventions with evidence from replicated RCTs, meaning this is not a unique strength of the evidence on coaching.

Strength 2: Evidence from meta-analysis

In 2018, a team of researchers from Brown and Harvard published a meta-analysis of all available studies on instructional coaching. They found 31 causal studies (mostly RCTs) looking at the effects of instructional coaching on attainment, with an average effect size of 0.18. The average effect size was lower in studies with larger samples, and in interventions that targeted general pedagogical approaches, however these were still positive and statistically significant.

A second, smaller meta-analysis looking at CPD interventions in literacy teaching also concluded that coaching interventions were the most effective in terms of increasing pupil attainment.

The evidence from the replicated MTP trials described above shows that good instructional coaching interventions can be effective. The evidence from meta-analysis reviewed here broadens this out to show that evaluated coaching programmes work on average.

How does this compare to other forms of CPD? There are very few meta-analysis relating to other forms of professional development, and those we do have employ weak inclusion criteria, making it hard to interpret their results.

Strength 3: Evidence from A-B testing

Instructional coaching is a form of CPD. In practice, it must be combined with some form of content in order to be delivered to teachers. This begs the question of whether the positive evaluation results cited above are due to the coaching, or to the content which is combined with the coaching. Perhaps the coaching component of these interventions is like the mint flavouring in toothpaste: very noticeable, but not in fact an active ingredient in bringing about reduced tooth decay.

In February 2018, a team of researchers from South Africa published the results from a different type of randomised controlled trial. Instead of comparing treatment and control groups, they compared a control group to A) a group of teachers trained on new techniques for teaching reading at a traditional “away day” and B) a group of teachers trained on the exact same content using coaching. This type of A-B testing provides an opportunity to isolate the active ingredients of an intervention.

The results showed that pupils taught by teachers given the traditional “away day” type training showed no statistically significant increase in reading attainment. By contrast, pupils taught by teachers who received the same content via coaching improved their reading attainment by an effect size of 0.18. The coaching was therefore a necessary component of the training being effective. A separate A-B test in Argentina in 2017 also found coaching to be more effective than traditional training on the same content.

Besides these two coaching studies, there are very few other A-B tests on CPD interventions. Indeed, a 2017 review of the A-B testing literature found only one evaluation which found different results for the two treatment comparisons – a joint analysis-of-practice of video cases programme. While very promising, this analysis-of-practice intervention does not yet have evidence from replicated trials or meta-analysis.

Strength 4: Evidence from systematic research programmes

A difficulty in establishing the superiority of one form of CPD is that you need to systematically test the other available forms. The Investing in Innovation (I3) Fund in the US does just this by funding trials on a wide range of interventions, as long as they have some evidence of promise. Since 2009, they have spent £1.4Bn testing 67 different interventions.

The chart below shows the results from 31 RCTs investigating the impact of interventions on English attainment (left chart) and a further 23 on maths attainment (right chart). Bars above zero indicate a positive effect, and vice versa. Green bars indicate a statistically significant effect and orange bars indicate an effect which, statistically speaking, cannot be confidently distinguished from zero. [i]

I3

Two things stand out from this graph. First, most interventions do not work. Just seven out of thirty-one English and three out of twenty-three maths interventions had a positive and statistically significant effect on pupil attainment. This analysis provides a useful approximation of what we can expect across a broad range of CPD interventions.[ii]

In order to compare instructional coaching with the evidence from I3 evaluations, I constructed an identical chart including all the effect sizes I could find from school-age instructional coaching evaluations. This is not an ideal comparison, because the I3 studies all get published, whereas the coaching RCTs may show some publication bias. But I think the comparison is instructive nevertheless. The chart (below) includes all the relevant studies from the Kraft et al meta-analysis for which effect sizes could be straightforwardly extracted [iii], plus three additional studies [iv]. Of the sixteen studies included, eleven showed positive, statistically significant impacts on attainment. This compares very favourably to I3 evidence across different forms of CPD.

Coaching I3

Conclusion

Instructional coaching is supported by evidence from replicated randomised controlled trials, meta-analysis, A-B testing and evidence from systematic research programmes. I have looked hard at the literature and I cannot find another form of CPD for which the evidence is this strong.

To be clear, there are still weaknesses in the evidence base for instructional coaching. Scaled-up programmes tend to be less effective than smaller programmes and the evidence is much thinner for maths and science than for English. Nevertheless, the evidence remains stronger than for alternative forms of CPD.

How should school leaders and CPD designers respond to this? Where possible, schools should strongly consider using instructional coaching for professional development. Indeed, it would be hard to justify the use of alternative approaches in the face of the existing evidence.

Of course, this will not be easy. My co-presenters Steve Fardon and Emily Henderson, both experienced coaches, were keen to stress that establishing coaching in a school comes with challenges.

Unfortunately, in England, lesson observation has become synonymous with remedial measures for struggling teachers. Coaches need to demonstrate that observation for the purposes of instructional coaching is a useful part of CPD, not a judgement. I have heard of one school tackling this perception by beginning coaching with senior and middle leaders. Only once this had come to be seen as normal did they invite classroom teachers to take part.

Another major challenge is time. Emily Henderson stressed that if coaching sessions are missed it can be very hard to get the cycle back on track. Henderson would ensure that the coaching cycle was the first thing to go in the school diary at the beginning of the academic year and she was careful to ensure it never got trumped by other priorities. Some coaching schools have simply redistributed inset time to coaching, in order to make this easier.

Establishing coaching in your school will require skilled leadership. For the time being however, coaching is the best-evidenced form of professional development we have. All schools that aspire to be evidence-based should be giving it a go.

Follow me: @DrSamSims

UPDATE: If you want to read more about IC, I recommend Josh Goodrich’s blog series here.

[i] I wouldn’t pay too much attention to the relative size of the bars here, since attainment was measured in different ways in different studies.

[ii] Strictly speaking, only 85% of these were classed as CPD interventions. The other 15% involve other approaches to increasing teacher effectiveness, such as altering hiring practices. It should be noted that the chart on the left also includes some coaching interventions!

[iii] It should be noted that I did not calculate my own effect sizes or contact original authors where effect sizes were not reported in the text. To the extent that reporting of effect sizes are related to study findings, this will skew the picture.

[iv]  Albornoz, F., Anauati, M. V., Furman, M., Luzuriaga, M., Podesta, M. E., & Tayor, I. (2017) Training to teach science: Experimental evidence from Argentina. CREDIT Research Paper.

Bruns, B., Costa, L., Cunha, N. (2018) Through the looking glass: Can classroom observation and coaching improve teacher performance in Brazil? Economics of Education review. 64, 214-250.

Cilliers, J., Fleisch, B., Prinsloo, C., Reddy, V., Taylor, S. (2018) How to improve teaching practice? Experimental comparison of centralized training and in-classroom coaching. Working Paper.